
Last week you learned the fundamental position sizing formula: (Account × Risk%) ÷ (Entry - Stop Loss). If you’ve been practicing it, you’ve probably noticed something: not all trades are created equal. A stable blue-chip stock moving 1-2% daily requires different position sizing than a volatile small-cap that swings 5-10%. A leveraged account demands different calculations than a cash account. And what happens when you’re holding multiple positions in the same sector?
This week, we’re diving into advanced position sizing techniques that separate competent traders from true professionals.
Adjusting for Volatility: The Hidden Risk Multiplier
Two stocks can both be at $50 with a stop-loss at $48, giving you $2 risk per share. But if Stock A typically moves $1 per day while Stock B moves $5 per day, they present very different risks.
Reduce position sizes for highly volatile assets, and consider using ATR (Average True Range) to adjust your risk based on market volatility .
What is ATR?
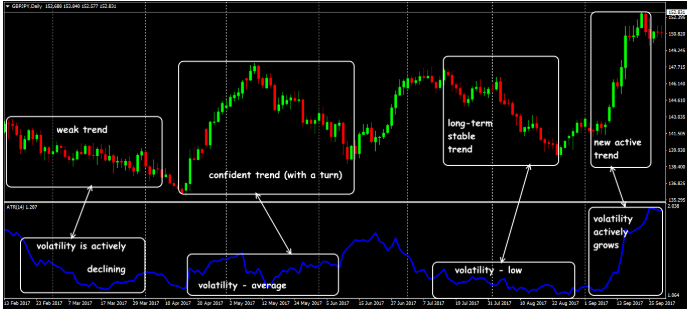
Average True Range measures how much a stock typically moves in a given period. It’s a volatility indicator that tells you: “This stock usually moves $X per day.”
ATR-Adjusted Position Sizing:
Instead of using a fixed stop-loss distance for all stocks, use ATR multiples:
∙ Tight stop: 1× ATR
∙ Normal stop: 2× ATR
∙ Wide stop: 3× ATR
Example:
- Stock A (Low Volatility):
- Price: $100
- ATR (daily): $2
- Stop at 2× ATR: $100 - $4 = $96
- Risk per share: $4
- Stock B (High Volatility):
- Price: $100
- ATR (daily): $8
- Stop at 2× ATR: $100 - $16 = $84
- Risk per share: $16
If you’re risking $500 per trade:
∙ Stock A: $500 ÷ $4 = 125 shares ($12,500 position)
∙ Stock B: $500 ÷ $16 = 31 shares ($3,100 position)
Same dollar risk, but dramatically different position sizes based on the stock’s natural volatility.
Real-World Application:
During earnings season, a stock’s ATR often doubles or triples. If NVDA normally has a $5 ATR but jumps to $15 during earnings week, your position size should be 1/3 the normal size to maintain the same dollar risk.
Maximum Position Size Rules
Even when the math says you can buy 1,000 shares, position concentration limits prevent you from having too much capital in any single trade.
Maximum exposure percentage is a safety cap that prevents allocating too much of your total account to one single stock ticker .
Professional Position Limits:
-
Individual Position Limit: 20-25% of total account value maximum
-
Prevents single-stock disaster risk
-
Ensures diversification
-
Protects against overnight gaps
-
Sector Limit: 30-40% of total account value maximum
-
Prevents sector-wide collapse damage
-
Accounts for correlation between stocks
-
Important during sector rotations
-
Total Market Exposure: 60-80% maximum (rest in cash)
-
Preserves dry powder for opportunities
-
Reduces stress during market corrections
-
Allows for averaging down on best ideas
Sometimes protecting against concentration risk trumps maximizing individual trade risk. There is no one-size-fits-all approach to risk management, but it is generally best to risk less than 2% of your account on any given trade and use stop losses as a way to manage risk .
Pattern Day Trader Rules (US Markets):

If your account is under $25,000:
∙ Limited to 3 day trades per 5 business days
∙ No leverage for day trading
∙ Forces swing trading or careful day trade selection
If your account is over $25,000:
∙ Unlimited day trades
∙ 4:1 intraday leverage
∙ 2:1 overnight leverage

Leverage Impact on Position Sizing:
Many traders misunderstand leverage and position sizing.
Wrong Approach:
“I have a $10,000 account with 4:1 leverage = $40,000 buying power, so I’ll risk 2% of $40,000 = $800 per trade.”
Right Approach:
“I have a $10,000 account. I risk 2% of my actual capital = $200 per trade. Leverage just allows me to take larger positions with that $200 risk, but doesn’t change how much I should risk.”
- Example:
- Account: $10,000 (with 4:1 leverage = $40,000 buying power)
- Risk: 2% = $200
- Trade Setup:
- Entry: $100
- Stop: $99
- Risk per share: $1
Without Leverage: Buy 200 shares = $20,000 position (within buying power)
The leverage gives you access to the capital needed, but you still only risk $200 of your actual money. Leverage amplifies both gains and losses but doesn’t change your risk calculation—always calculate position size based on your actual account balance and risk tolerance, not the leveraged amount. For traders with substantial historical data (100+ trades minimum), the Kelly Criterion offers a mathematically optimal position sizing method.
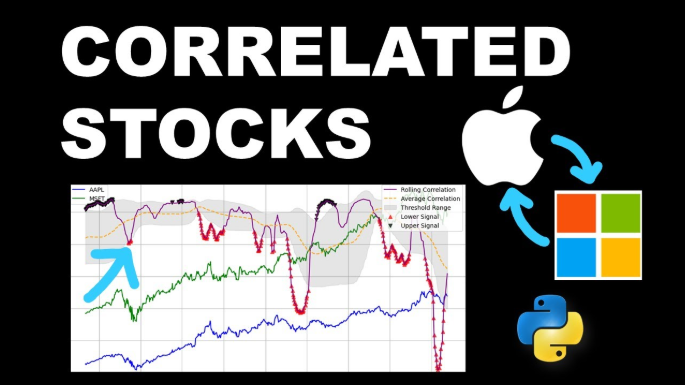
Handling Correlated Positions
Avoid over-concentration in correlated assets—multiple positions in similar sectors effectively increases your risk beyond your individual trade limits.
The Correlation Trap:
You find three great setups:
-
-
- AAPL: Risk 2% = $200
- MSFT: Risk 2% = $200
- NVDA: Risk 2% = $200
-
Total risk: 6%, right?
Wrong. All three are mega-cap tech stocks. When tech sells off, they often move together. Your real risk is closer to 5-5.5% because they’re highly correlated.
Managing Correlated Risk:
Method 1: Reduce Individual Position Sizes
∙ If taking 3 correlated positions, risk 1.5% each instead of 2%
∙ Total intended risk: 4.5% (accounts for 75% correlation)
Method 2: Sector Position Limits
∙ Limit total tech exposure to 6% risk across all positions
∙ Forces diversification into other sectors
Method 3: Risk Factoring
∙ Multiply your normal risk by the correlation factor
∙ If correlation is 0.7 (70%), multiply risk by 1.7
∙ Three 2% positions = 3 × 2% × 1.7 = 10.2% actual risk
Practical Application:
Before taking a third position in the same sector, ask: “If this sector corrects 10% tomorrow, what happens to my account?”
If the answer is “I lose 8-10%,” you’re overexposed to that sector regardless of what your individual position risks say. Options require different position sizing because of leverage and time decay. Many traders reduce position size to 50-75% of what they’d use for stock to account for the additional leverage and volatility.
The Professional’s Position Sizing Workflow
Here’s exactly how a professional sizes every position:
- Step 1: Technical Analysis
-
- Identify entry and stop-loss based on chart
- Note current ATR if relevant
-
-
-
- Check for upcoming events (earnings, Fed meetings)
-
- Step 2: Risk Assessment
-
- Standard risk: 1-2%
- High-conviction trade: 2-3%
- Uncertain setup: 0.5-1%
- Adjust for volatility (reduce if ATR is elevated)
-
- Step 3: Calculate Base Position Size
-
- Apply formula: (Account × Risk%) ÷ (Entry - Stop)
-
- Step 4: Apply Position Limits
-
- Check if position exceeds 25% of account (reduce if yes)
- Check sector exposure (adjust if overconcentrated)
- Verify total market exposure under 80%
-
- Step 5: Correlation Check
-
- Review existing positions
- Reduce size if high correlation exists
-
- Step 6: Final Verification
-
- Does the position size feel reasonable?
- Can you emotionally handle the risk?
- Is the risk/reward still favorable?
-
- Step 7: Execute
-
- Place order with calculated shares
- Set stop-loss immediately
- Document in trading journal
-
This process takes 2-3 minutes once you’re experienced. It’s the difference between professional trading and gambling.
Basic position sizing teaches you the formula. Advanced position sizing teaches you when and how to deviate from it based on volatility, correlation, leverage, and market conditions.
The goal isn’t to follow rigid rules blindly; it’s to understand the principles well enough to make informed adjustments while maintaining disciplined risk management.
This week, practice:
1. Calculating ATR for your watchlist stocks
2. Checking correlation between your current positions
3. Reviewing your maximum position sizes
4. Using a position size calculator for every trade
Position sizing mastery isn’t about complex math—it’s about consistent application of sound principles. Every professional trader does this. Now you know how.
References:


Responses