You’ve spent March learning how to protect your capital. Now let’s talk about when the market tends to cooperate and when it doesn’t. Welcome to seasonality. It won’t tell you what to buy. But it will give you a smarter lens for understanding the market you’re watching every week.
What Is Seasonality?
Seasonality refers to particular timeframes when stocks, sectors, and indices are subjected to recurring tendencies that produce patterns in investment valuation. The key is that the tendency is recurring and provides a sustainable probability of performing in a manner consistent with previous results. Think of it like weather patterns. You don’t know exactly what April 14th will look like, but you know spring is generally warmer than January. Seasonality works the same way, it tells you what the market has tended to do, not what it will do. That distinction matters enormously for beginners.
Why April Historically Matters
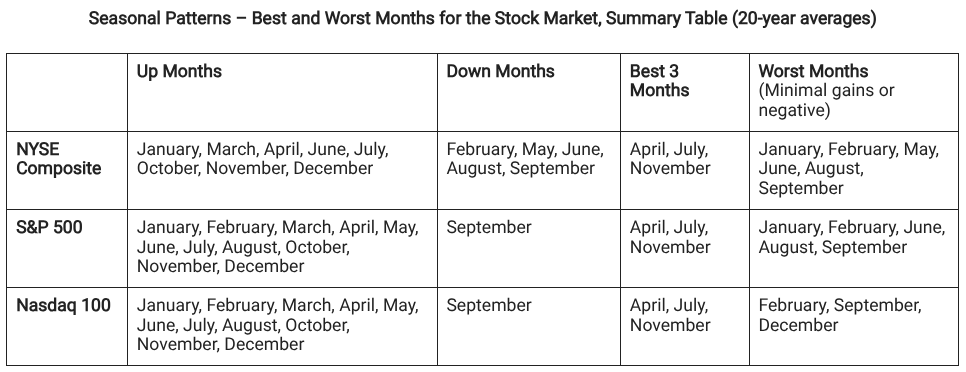
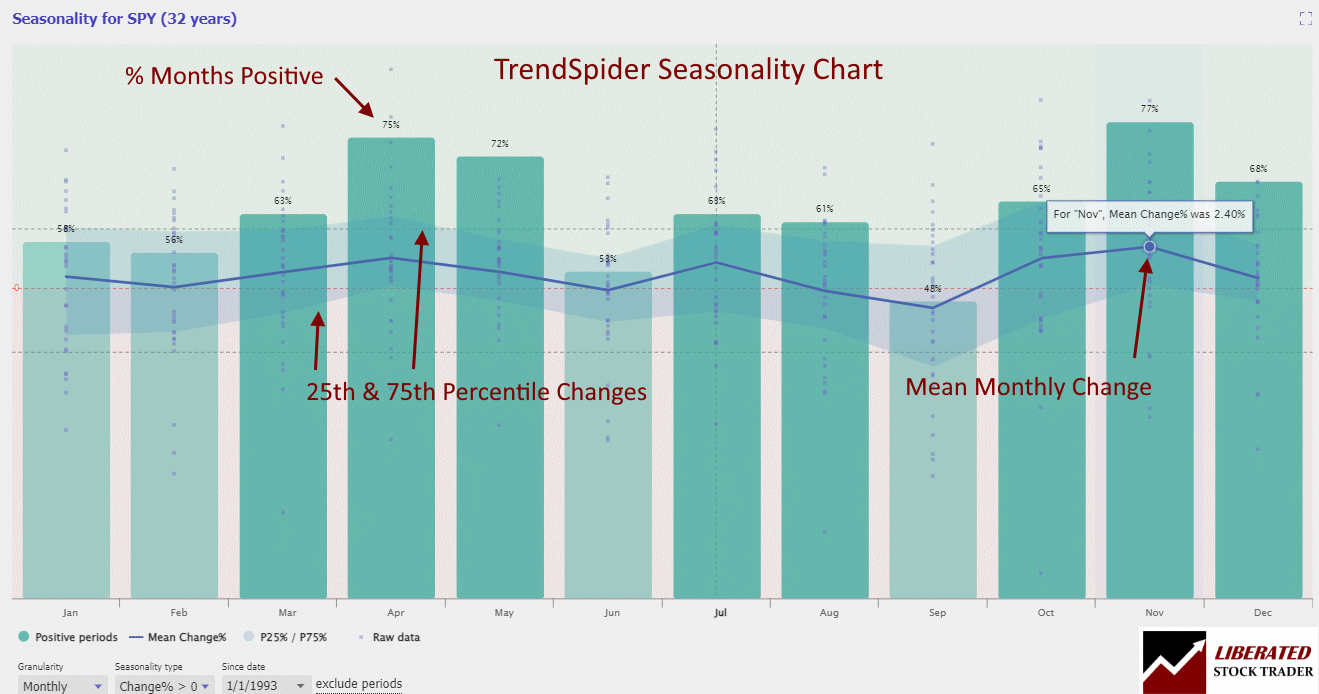
Here’s the good news for right now: you’re reading this in one of the market’s strongest months on record. April has historically been one of the best months of the year, pushing higher nearly 70-80% of the time with average gains of around 2% across the major indices over the last 20 years.  Across the S&P 500, Dow, and Nasdaq, April, July, and November are the three strongest months, each closing green roughly 80% of the time. 
Why does April tend to perform well? Two main drivers:
-
Earnings season. April kicks off the first major earnings reporting period of the year, when large companies announce their quarterly results. Positive earnings reports bring investor confidence and buying activity, which pushes prices higher.
-
Institutional repositioning. After a typically choppy January and February, fund managers and institutional investors often use spring to reposition their portfolios, injecting fresh capital into the market. March often serves as a structural reversal point where the market establishes a first-quarter low before beginning a spring recovery. 
The Bigger Picture: November Through April
April doesn’t exist in isolation. It’s actually the final month of what market historians call the strongest six-month window of the year. The November–April window has delivered meaningfully stronger cumulative returns than the summer months, reinforcing the idea that market momentum tends to be front-loaded into the late fall, winter, and early spring. 
You may have heard the old Wall Street saying: “Sell in May and go away.” We’ll dig into that fully in Week 5, but for now understand that it exists because May marks the end of this historically strong stretch. The shift from April to May is one of the most talked-about transitions on the trading calendar, and you’ll be watching it happen in real time this year.
What About 2026 Specifically?
Seasonality is historical data. Real markets layer current events on top of those patterns and 2026 has had plenty of them. 2026 falls into a midterm year, a phase of the presidential cycle that has historically been associated with higher volatility but also relatively strong full-year returns. Approximately 87% of midterm years have ended with positive full-year returns, with an average annual performance exceeding 19%. 
At the same time, the current economic and market cycle is characterized by instability rather than mere uncertainty, manifesting as rapid shifts in key determinants affecting economic sectors unevenly; creating heightened volatility and ongoing rotation within the stock market.  In plain terms: sectors are taking turns leading. What was hot in 2025 isn’t necessarily hot now. Real assets are leading the charge in 2026, with gold, metals, and mining companies showing outstanding performances, a meaningful shift from the AI and tech dominance of last year.
This is seasonality and sector rotation working together in real time. You’re not just reading about it - you’re watching it happen.
The Beginner’s Takeaway: A Lens, Not a Signal
Here’s the most important thing to understand about seasonality: think of seasonality as a tool, not a crystal ball. It shows historical tendencies, not what will happen this year. If the market tends to rise 80% of the time in April, that means it went up in 16 of the last 20 years but it may not go up this year. This connects directly back to your March foundation. Even in the most historically bullish months, your stop-loss still gets set. Your position size still gets calculated. Your circuit breakers still apply. Seasonality might give you a tailwind but it doesn’t give you a guarantee.
Calendar effects serve best as a supporting lens rather than a primary investment signal, useful for context, but insufficient on their own to drive portfolio decisions. Use it accordingly. Add it to what you already know, not instead of it.
Your April Action Step
As you run your simulator this month, start paying attention to the broader market direction each week. Ask yourself:
• Is the market moving up, down, or sideways this week?
• Which sectors are leading and which are lagging?
• Does what you’re observing match or contradict what seasonality suggests?
You don’t need to act on any of it yet. You just need to start seeing it. That awareness, built over April and May, is exactly what Week 7’s watch list article will put to practical use.
The market has patterns. Now you know how to read them.
References


Responses