
If support and resistance levels are the foundation of technical analysis, chart patterns are the architecture that shows you where price is likely headed next. The most reliable chart patterns in 2026 are the Head and Shoulders with an 89% success rate, Double Bottom at 88%, and Bull Flag at 85%. These patterns package market psychology, fear, greed, and hesitation, into recognizable shapes you can spot and trade with a clear plan.
Understanding Triangle Patterns
Triangle patterns are among the most common formations you’ll encounter, and they come in three main varieties that signal different market intentions.
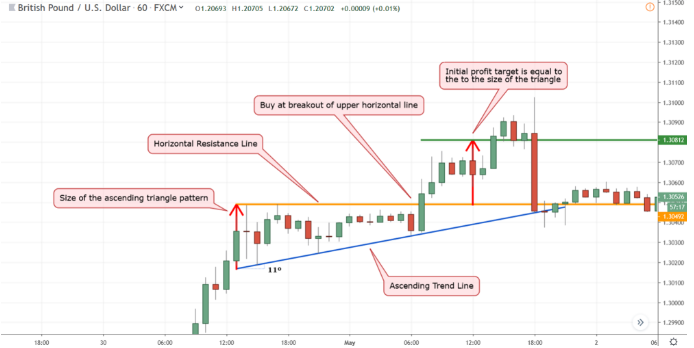
Ascending Triangle (Bullish)
An ascending triangle is a bullish continuation pattern characterized by a horizontal resistance line and a rising support line, indicating buyers are becoming more aggressive and pushing the price higher. Picture a series of higher lows meeting a flat ceiling of resistance, buyers are gaining strength with each test.
The breakout happens to an uptrend when the resistance and support levels have been retested many times. When you spot an ascending triangle in February’s current market environment, look for at least three touches on both the resistance and support lines before the pattern confirms.
Descending Triangle (Bearish)
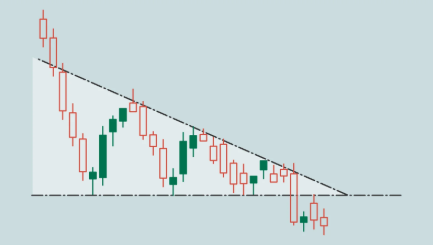
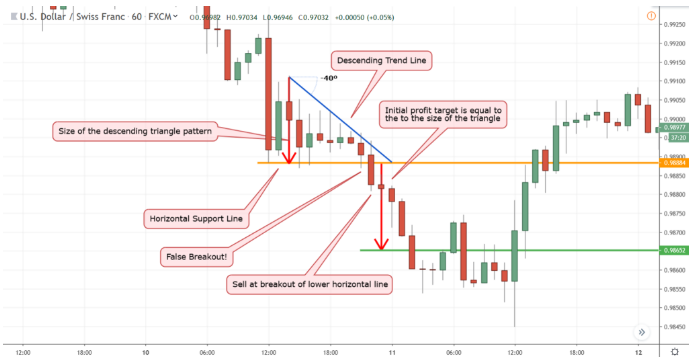
The mirror image of the ascending triangle, a descending triangle is a bearish continuation pattern with a horizontal support line and a falling resistance line, suggesting sellers are becoming more aggressive and pushing the price lower. Each lower high shows sellers taking control, eventually breaking through the support floor.
Symmetrical Triangle (Neutral)
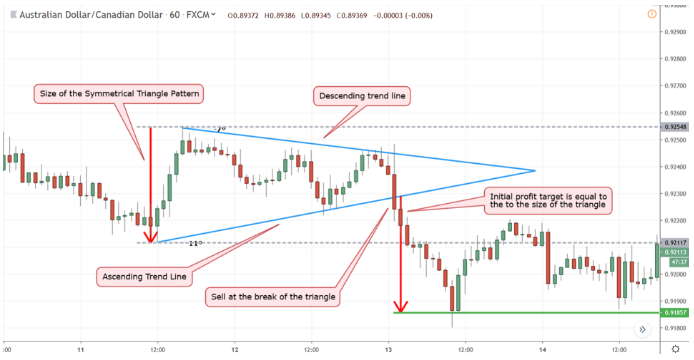
A symmetrical triangle forms when lower highs and higher lows converge, indicating market indecision with a breakout likely in the direction of the prior trend but not guaranteed. Volume contracts as price coils, then a spike confirms the chosen direction.
Trading Triangles in February 2026
For all triangle patterns, wait for a decisive close outside the boundary with increased volume. Set your stop-loss beyond the opposite trendline and use the widest part of the triangle projected from the breakout as your price target. A quick pullback to test the broken level often provides a cleaner entry with smaller risk.
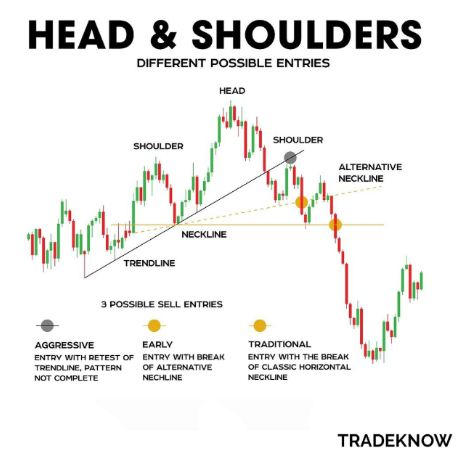
The Head and Shoulders
The Head and Shoulders pattern remains one of the most powerful and reliable reversal signals in technical analysis.
Classic Head and Shoulders (Bearish Reversal)
This pattern features a clearly visible left shoulder, head, and right shoulder formation where the neckline acts as critical support; breaking it confirms the pattern. Think of it as three peaks where the middle one (the head) is the highest, flanked by two lower peaks (the shoulders).
Volume generally declines during the formation and increases on breakdown, with the right shoulder ideally forming on lighter volume compared to the left. This tells you that buying pressure is exhausting itself.
How to Trade It:
Enter a short trade once the price breaks below the neckline with increased volume, place your stop-loss above the right shoulder to manage risk, and set your target by measuring the vertical distance from the head to the neckline and subtracting it from the breakout point. This pattern is highly effective on daily and weekly charts for spotting medium-to-long term trend reversals, though it works on lower timeframes when aligned with broader trend weakness.
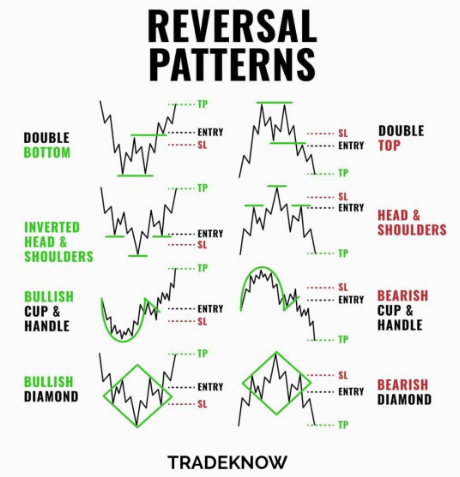
Inverse Head and Shoulders (Bullish Reversal)
The upside-down version signals a shift from downtrend to uptrend. Go long when price breaks out above the neckline on strong volume, set your stop-loss just below the right shoulder low, and measure the distance from the head to the neckline projecting it upward from the breakout point for your target.
Flag Patterns: Continuation with Precision
Flag patterns are short-term continuation patterns that appear after strong price movements, representing brief consolidations before the trend resumes.
Bull Flag
Imagine a flagpole (the sharp upward move) with a small rectangular flag (a slight downward drift or sideways consolidation) at the top. Once the price breaks out of the bull flag formation, traders open long positions with stop-loss set within the flag near the point where the upward movement began .
The beauty of bull flags is their reliability when confirmed properly. Volume should decrease during the flag formation and spike on the breakout, confirming renewed buying interest.
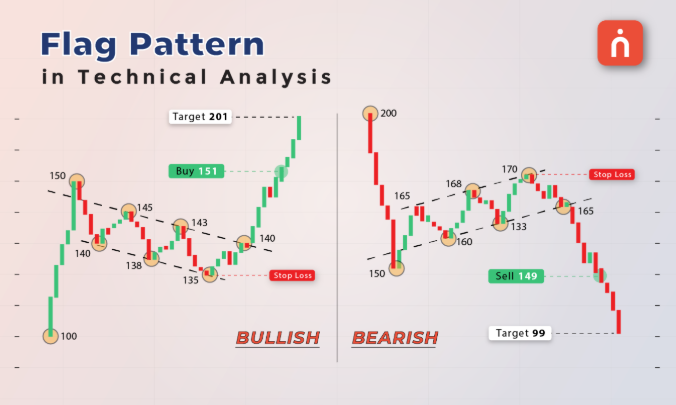
Bear Flag
The inverse of the bull flag: a downward move (the pole) followed by a slight upward drift or sideways consolidation (the flag). These signal the downtrend will likely continue after the brief pause.
Trading Flags in Current Markets:
Set your profit target at a distance equal to the height of the flagpole measured from the breakout point. These patterns work particularly well on 5-minute to 1-hour charts for active traders, but also appear on daily charts for swing traders.
Combining Patterns with Volume and Indicators
Most losses come from chasing the first break; wait for the throwback or pullback to the breakout line, and if price retests and holds, the move is more credible. Use simple secondary filters like RSI, which should hold above 50 on bullish breaks (below 50 for bearish), or MACD should confirm direction with expanding bars away from zero.
Critical Mistakes to Avoid
The most profitable pattern traders focus on just 2-3 formations they understand completely rather than trying to master every pattern, specialization beats diversification in pattern recognition. Start with rectangles, ascending and descending triangles, and bull and bear flags before moving to more complex formations. Pattern execution trumps pattern perfection, the cleanest formation means nothing without proper entry timing, position sizing, and exit strategy. Chart patterns work about 60-70% of the time when properly identified and traded with appropriate risk management, so focus on favorable risk-to-reward ratios rather than perfect accuracy.
The Bottom Line
Chart patterns are your visual roadmap to understanding where market psychology might take price next. Whether you’re spotting a triangle building tension, a head and shoulders signaling exhaustion, or a flag promising continuation, these formations give you concrete entry and exit points rather than trading on hunches. Practice identifying these patterns on historical charts before risking real capital. Keep a trading journal tracking which patterns work best in your style and timeframe. Most importantly, always confirm with volume and wait for the pattern to complete rather than anticipating the breakout, patience and discipline separate profitable pattern traders from those who struggle.
References:


Responses