
Last week we covered the fundamentals of risk management—the 1-2% rule, stop-losses, and risk-to-reward ratios. This week, we’re tackling the single most important question every trader faces: “How many shares should I buy?”
Most beginners pick arbitrary numbers. “I’ll buy 100 shares” or “I’ll invest $5,000 in this stock.” This approach ignores the actual risk of the trade and leads to inconsistent results. Position sizing is the precise mathematical bridge between your risk management rules and your actual trades. Master this simple formula, and you’ll never again wonder whether you’re risking too much or too little.
Why Position Sizing Trumps Win Rate
Here’s a shocking truth: A trader with a 40% win rate and proper position sizing will outperform a trader with a 60% win rate who sizes positions randomly. Professional traders typically risk 1-3% of their account per trade, which ensures you can survive multiple losing trades while preserving capital for profitable opportunities.
Example: Over 10 trades with proper 2% risk management versus random sizing, the disciplined trader with fewer wins often comes out ahead because they protect capital during losses and avoid catastrophic drawdowns.
The Core Position Sizing Formula
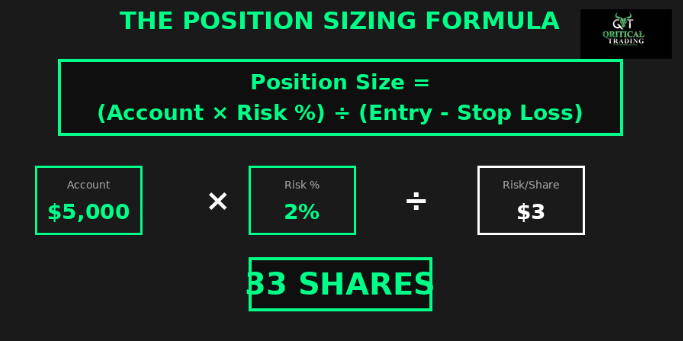
Position Size = (Account Size × Risk %) ÷ (Entry Price - Stop Loss)
This simple formula ensures you risk exactly what you intend on every trade. Let’s break it down:
∙ Account Size: Your total trading capital
∙ Risk %: The percentage you’re willing to lose (typically 1-2%)
∙ Entry Price: Where you plan to buy
∙ Stop Loss: Where you’ll exit if wrong
∙ Risk Per Share: Entry Price - Stop Loss
Real-World Example:
You have a $25,000 account and find a stock setting up near support.
∙ Account Balance: $25,000
∙ Risk Per Trade: 2% = $500
∙ Entry Price: $75
∙ Stop Loss: $72 (below support)
∙ Risk Per Share: $3
Position Size = $500 ÷ $3 = 166 shares
At 166 shares, if stopped out at $72, you lose exactly $498—your planned 2% risk. Not $1,000. Not $5,000. Exactly what you planned.
Understanding Risk Parameters
Risk per trade percentage is the percentage of your total equity you are willing to lose if the stop loss is hit, with professionals often keeping this between 0.5% and 2%.
-
Conservative (0.5-1% risk): Best for new traders or volatile markets. Requires 100-200 consecutive losses to blow up your account.
-
Moderate (1-2% risk): Standard professional approach. Requires 50-100 consecutive losses to reach zero.
-
Aggressive (2-3% risk): Only for experienced traders with proven strategies. Requires 33-50 consecutive losses.
Never exceed 5% risk on a single trade. This can destroy your account during normal losing streaks.
Stop-Loss Placement: The Critical Input
Your stop loss should be based on technical analysis, not arbitrary percentages—place stops below support levels or above resistance levels.
-
-
Wrong Approach: “I’ll risk 5% on every trade regardless of chart structure.”
-
Right Approach: “The chart shows support at $48. I’ll place my stop at $47.50. Now I’ll calculate position size to risk exactly 2% at that stop level.”
-
Your stop-loss location comes from the chart. Your position size comes from the formula. Never reverse this order.
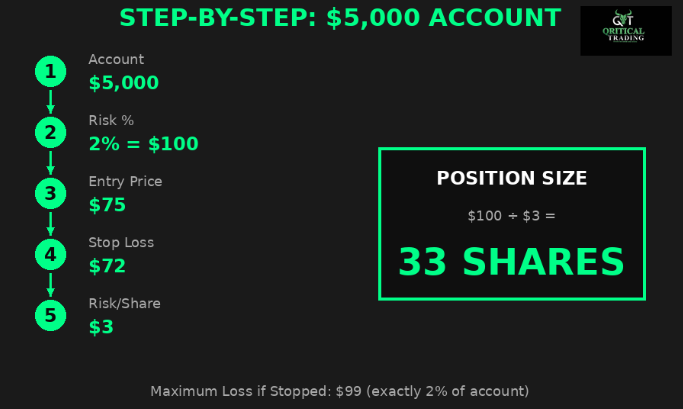
Step-by-Step Position Size Calculation
Let’s walk through a complete example.
Setup: Bullish flag pattern on a stock.
Step 1: Entry at breakout = $186
Step 2: Stop-loss below support = $179.50
Step 3: Risk per share = $186 - $179.50 = $6.50
Step 4: Account risk (1.5% of $50,000) = $750
Step 5: Position Size = $750 ÷ $6.50 = 115 shares
Step 6: Verify total position = 115 × $186 = $21,390
You buy 115 shares with a stop at $179.50. Maximum loss: $747.50 (exactly 1.5% of your account).
What happens next:
If stopped out: Loss = $747.50, account = $49,252.50
If target hit at $200: Profit = 115 × $14 = $1,610, account = $51,610
Risk/reward = 2.2:1 ✓
The 2% Rule in Action
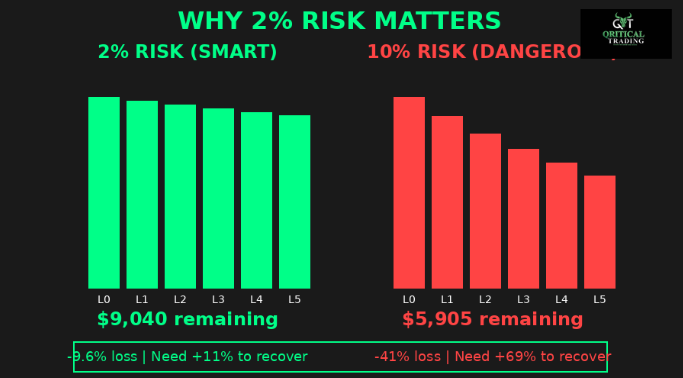
Let’s see how 2% risk protects you during a losing streak.
Starting account: $10,000
∙ Trade 1: Risk $200, stopped out = $9,800
∙ Trade 2: Risk $196 (2% of $9,800), stopped out = $9,604
∙ Trade 3: Risk $192, stopped out = $9,412
∙ Trade 4: Risk $188, stopped out = $9,224
∙ Trade 5: Risk $184, stopped out = $9,040
After 5 straight losses, you still have $9,040 (90.4% of capital). You need an 11% gain to recover. Compare this to a trader risking 10% per trade. After 5 losses, they’re down to $5,905 (41% loss) and need a 69% gain just to break even.
Common Position Sizing Mistakes
Mistake #1: Using Round Numbers
“I’ll buy 100 shares of everything.” This ignores actual risk. 100 shares of a $10 stock with $1 stop ($100 risk) is very different from 100 shares of a $200 stock with $10 stop ($1,000 risk).
Mistake #2: Position Sizing by Dollar Amount
“I’ll put $10,000 into each trade.” This fails to account for where your stop-loss is and can create wildly different risk levels.
Mistake #3: Moving Stops to Fit Desired Size
If the math says 200 shares but you want 500, never move your stop further away. This violates your technical analysis and multiplies your risk.
Mistake #4: Ignoring Account Changes
Always calculate based on current account value. As your account grows from $10,000 to $12,000, your 2% risk increases from $200 to $240.
Position Sizing Quick Reference
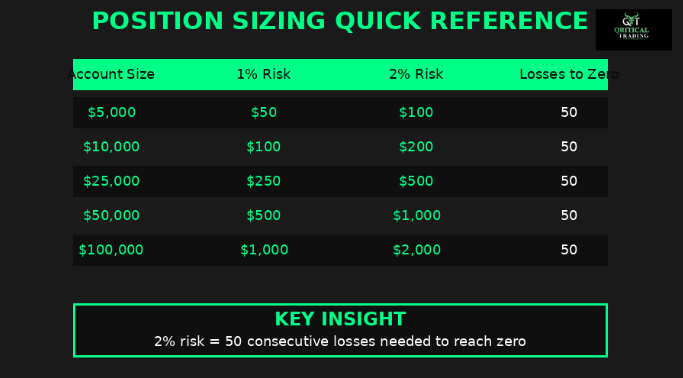
Notice that 2% risk always means you can survive 50 consecutive losses—regardless of account size.
Your Implementation Checklist
Before every trade, complete these steps:
1. Identify entry price (where you’ll buy)
2. Determine stop-loss (based on chart structure)
3. Calculate risk per share (entry minus stop)
4. Decide risk percentage (typically 1-2%)
5. Apply formula: (Account × Risk%) ÷ Risk Per Share
6. Verify the result makes sense
7. Place order with stop-loss immediately
Never place a trade without completing all seven steps.
There is no one-size-fits-all approach to risk management, but it is generally best to risk less than 2% of your account on any given trade and use stop losses as a way to manage risk. You can have the best chart patterns, perfect entries, and great market timing, but without proper position sizing, one bad streak can wipe you out. Next week, we’ll cover advanced position sizing: adjusting for volatility, handling leverage, managing correlated positions, and using the Kelly Criterion. For now, master this basic formula. Calculate it for every trade this week. Make it automatic. Your future self—still trading with a healthy account—will thank you.
References:


Responses