Candlestick charts are among the most popular tools used by traders to analyze price movements. Each candlestick represents price action over a specific time period and provides valuable insights into market sentiment. By recognizing and understanding candlestick patterns, traders can anticipate potential price reversals or continuations, improving their trading decisions. This article explains the most common candlestick patterns with visual examples and practical Pine Script code for detection.
Anatomy of a Candlestick
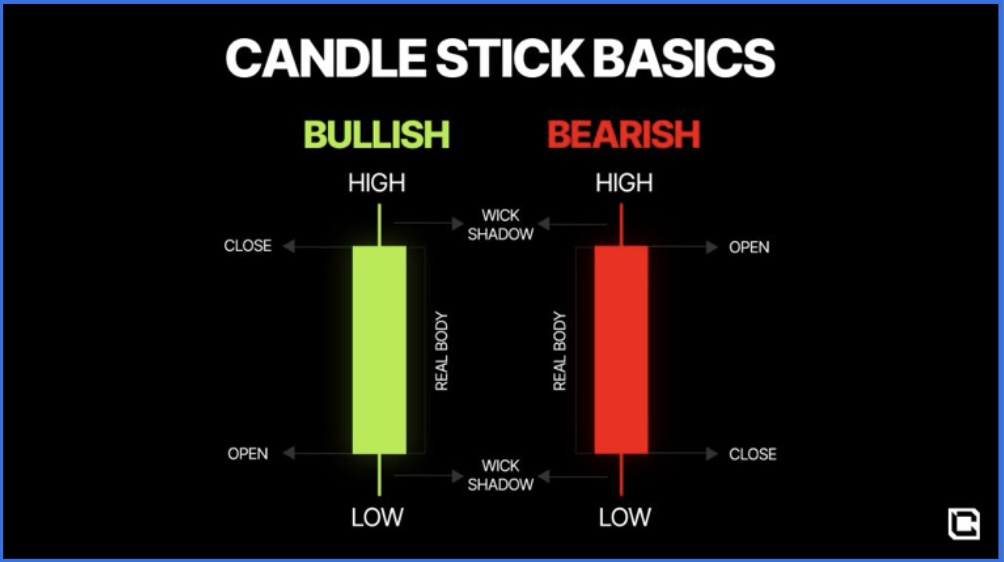
Before diving into patterns, it's essential to understand the components of a candlestick:
Body: The area between the open and close prices.
Upper Wick (Shadow): The line above the body showing the highest price.
Lower Wick (Shadow): The line below the body showing the lowest price.
Color: Indicates whether the price closed higher (bullish) or lower (bearish) than it opened.
Types of Candlestick Patterns
Reversal Patterns:
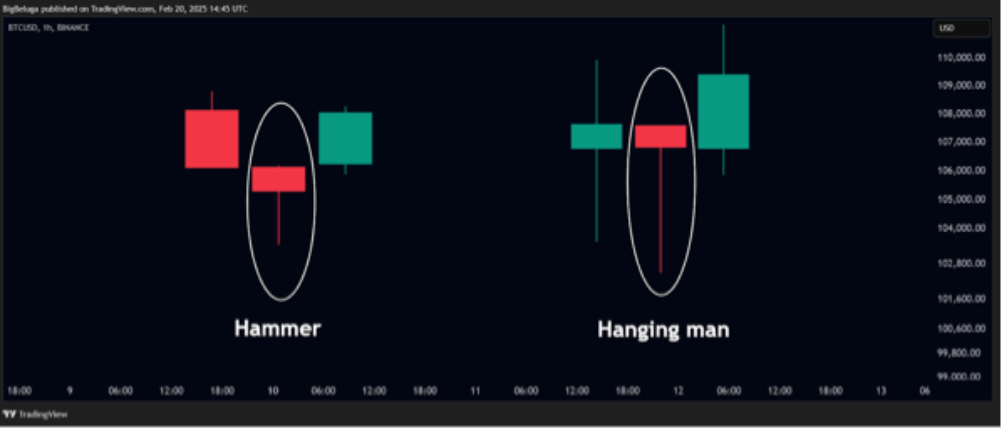
Hammer and Hanging Man:
Hammer: Appears at the bottom of a downtrend, signaling a potential bullish reversal.
Hanging Man: Appears at the top of an uptrend, signaling a potential bearish reversal.
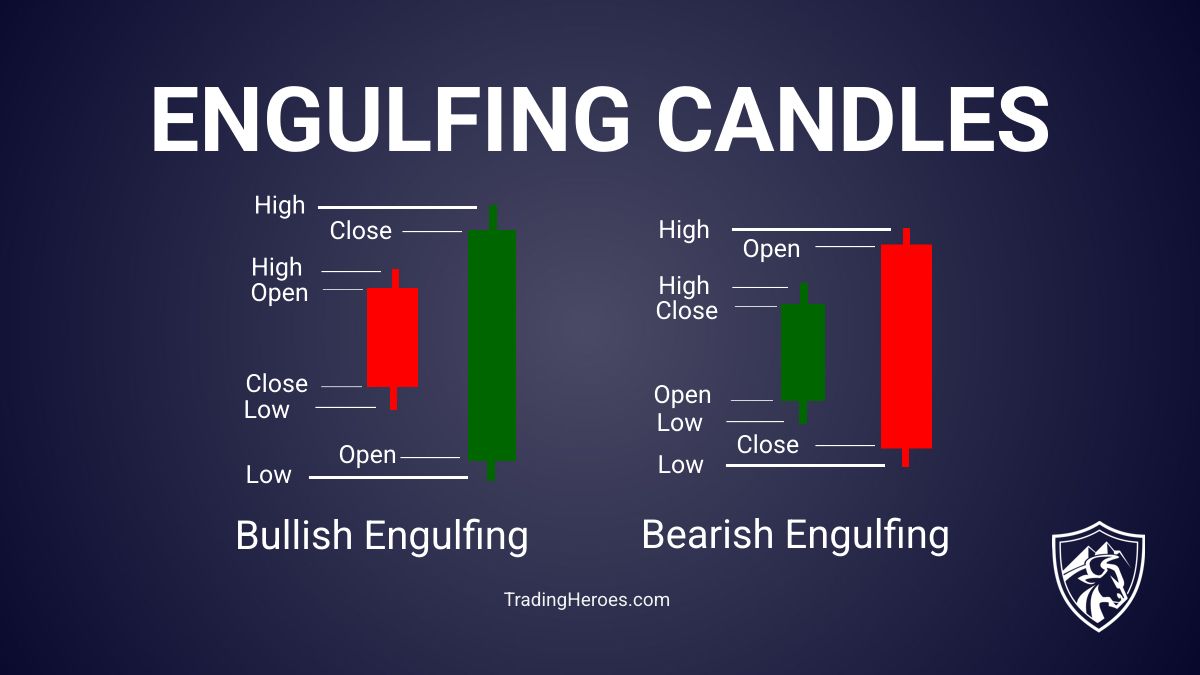
Engulfing Patterns:
Bullish Engulfing: A small bearish candle followed by a larger bullish candle that engulfs the previous one.
Bearish Engulfing: A small bullish candle followed by a larger bearish candle that engulfs it.
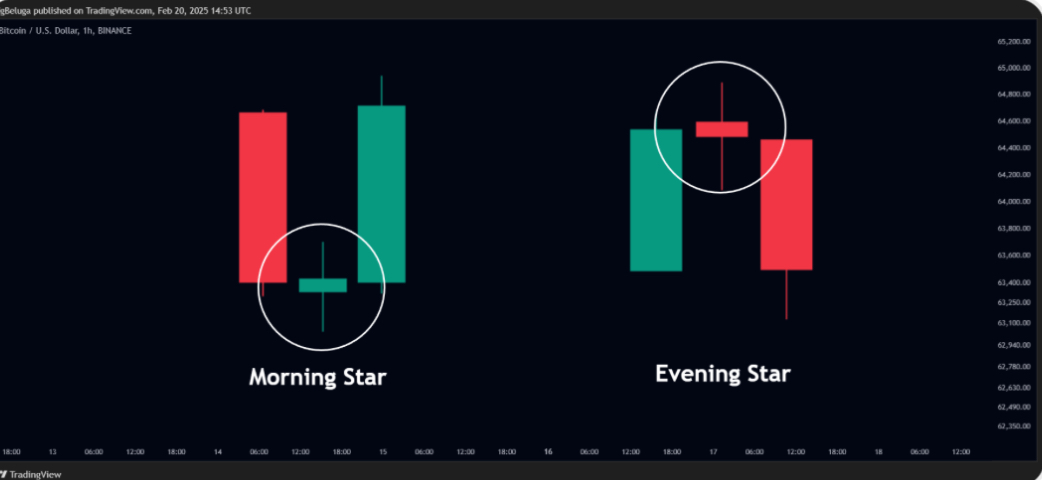
Morning Star and Evening Star:
Morning Star: A three-candle reversal pattern occurring at the bottom of a downtrend, consisting of:
1. A long bearish candle (indicates selling pressure).
2. A small-bodied candle (indecision).
3. A long bullish candle that confirms the reversal.
Evening Star: Appears at the top of an uptrend, indicating a potential bearish reversal:
1. A long bullish candle (strong buying pressure).
2. A small-bodied candle (indecision).
3. A long bearish candle that confirms the reversal.
Continuation Patterns
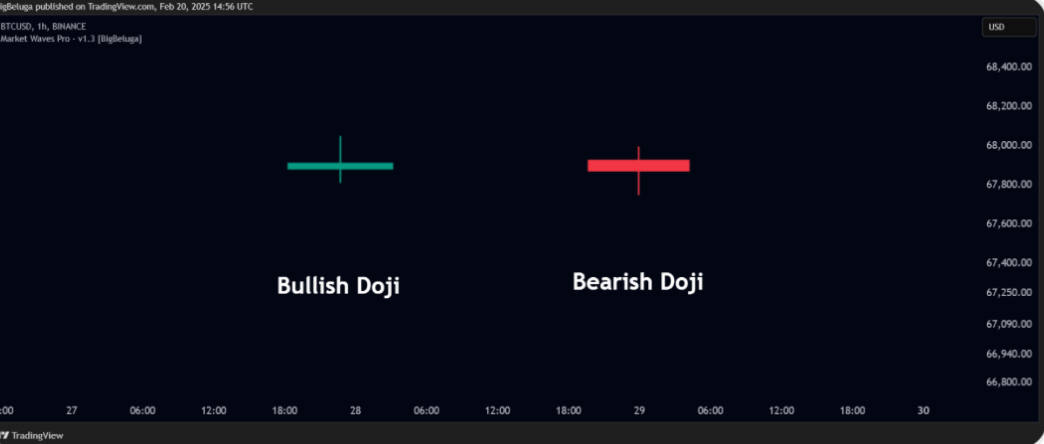
Doji Patterns: Candles with very small bodies, indicating market indecision. Variations include Long-Legged Doji, Dragonfly Doji, and Gravestone Doji.
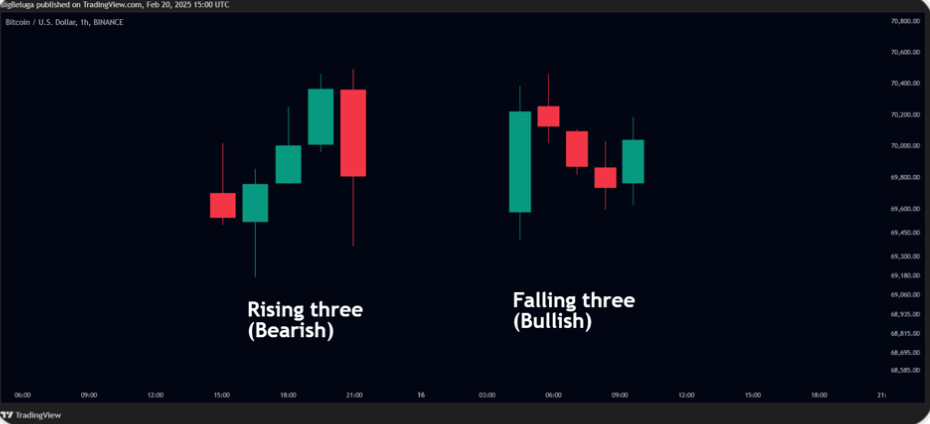
Rising and Falling Three Methods:
Rising Three Methods: Signals continuation of bullish momentum during an uptrend.
- A long bullish candle followed by three small bearish candles (temporary pullback), and another long bullish candle that confirms the uptrend.
Falling Three Methods: Indicates continuation of bearish momentum during a downtrend.
- A long bearish candle followed by three small bullish candles (weak upward retracement), and another long bearish candle that confirms the downtrend.
Practical Applications
-
Trend Reversal Identification: Use reversal patterns to anticipate changes in market direction.
-
Confirmation Signals: Combine candlestick patterns with indicators like RSI or Moving Averages for stronger signals.
-
Risk Management: Employ patterns to set stop-loss and take-profit levels.
Candlestick patterns are powerful tools that provide insights into market sentiment and potential price movements. By combining visual recognition with automated detection using Pine Script, traders can enhance their decision-making process. Practice spotting these patterns in real-time charts and backtest their effectiveness to build confidence in your trading strategy.

Responses