
You've heard it by now. Every financial channel, newsletter, and trading account you follow has said some version of it this week:
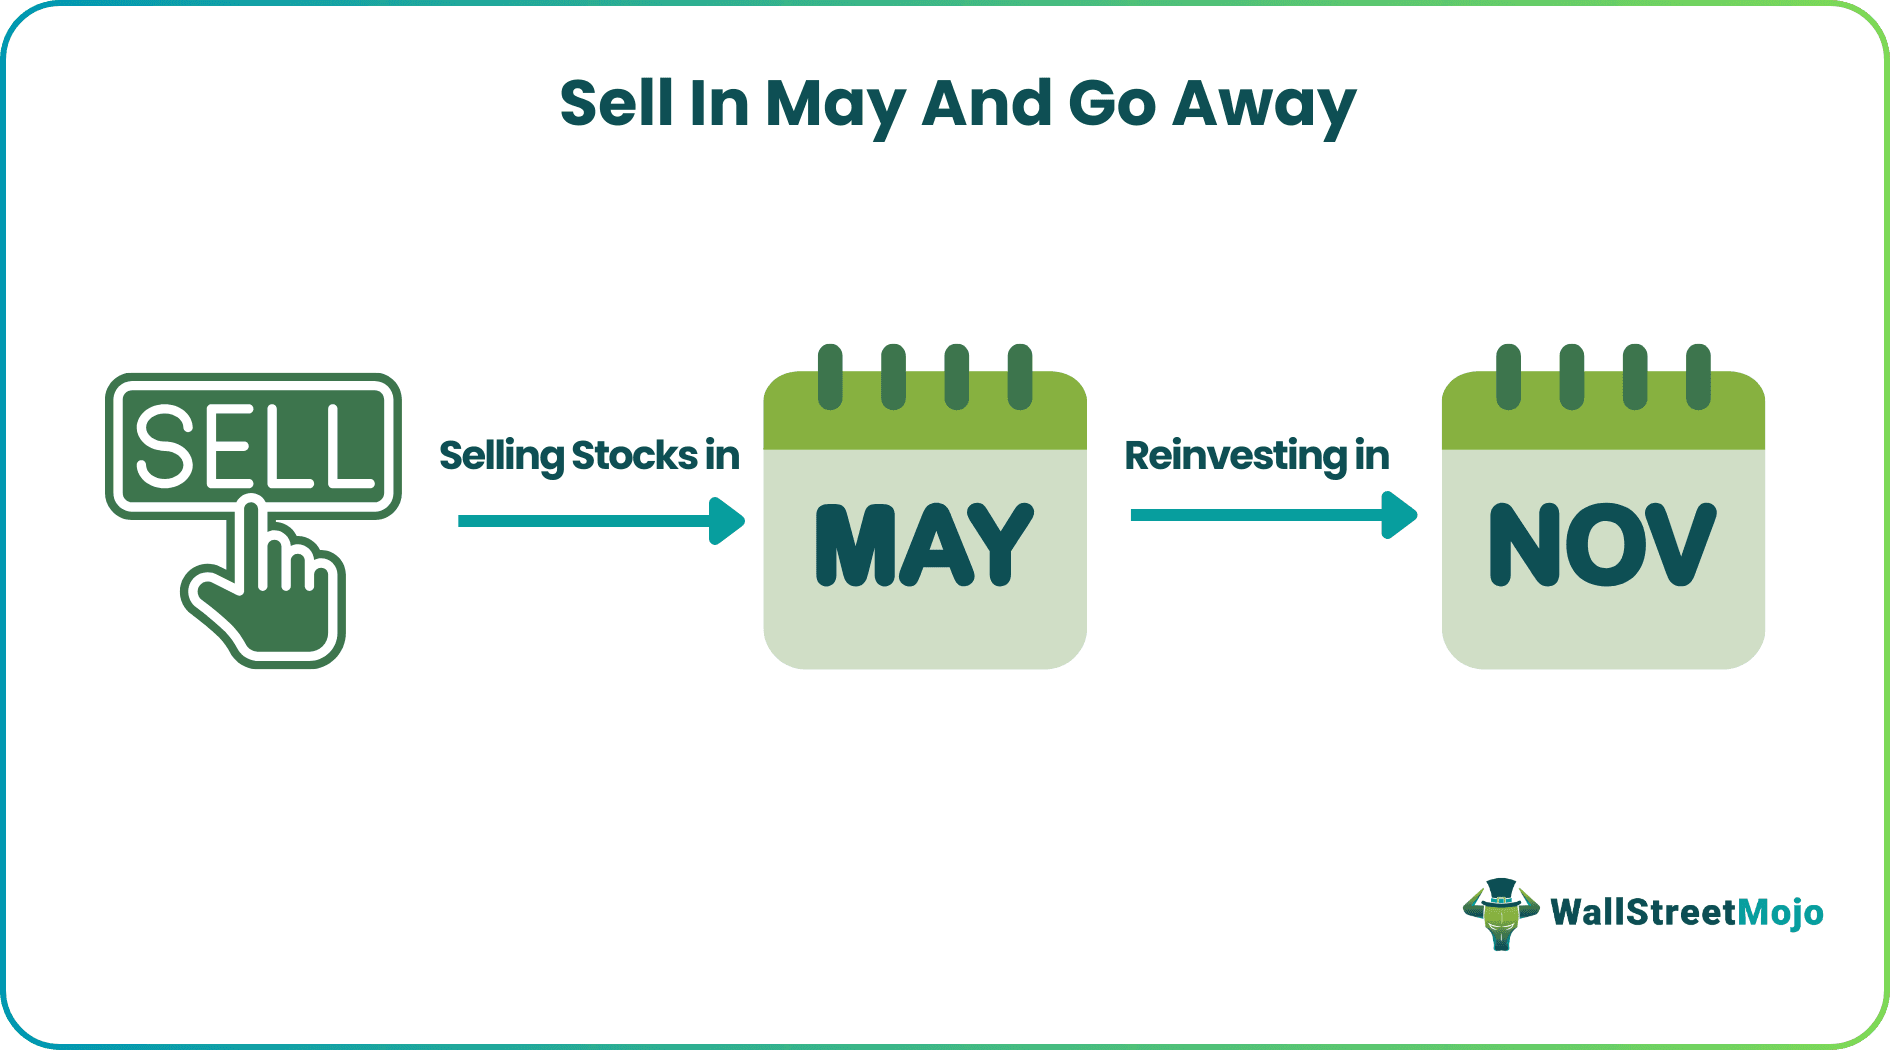
"Sell in May and go away."
It's everywhere. It sounds authoritative. And right now, as you're building your trading foundation heading into your first real-money month in July, it's worth asking: is it actually true? And more importantly, should it change what you're doing?
The short answer is: it's complicated. The longer answer is what makes you a smarter trader.
Where the Saying Came From

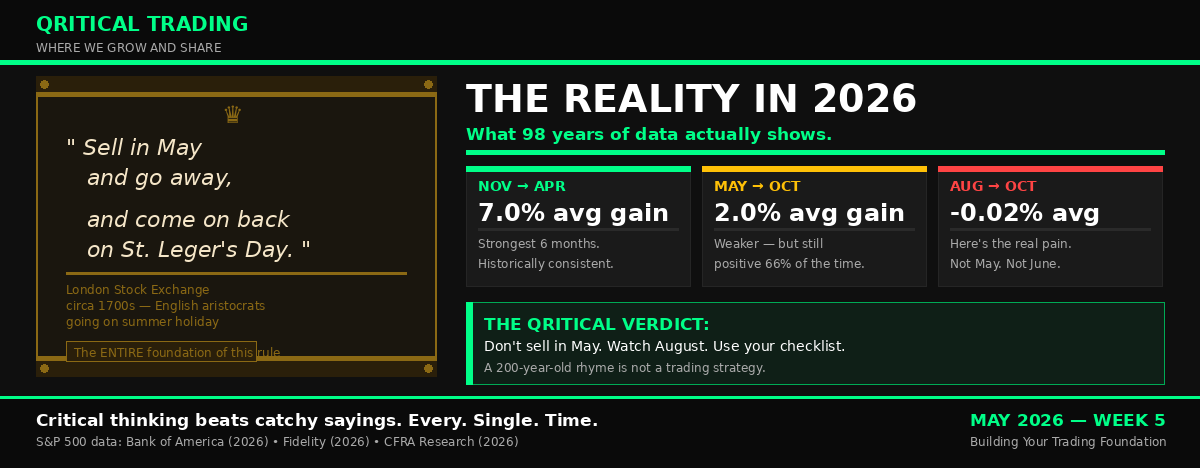
The phrase is a 200-year-old Wall Street adage born on the London Stock Exchange during a time when English aristocrats would leave the city each summer and trading volumes would collapse with them. The complete phrase "Sell in May and go away, and come on back on St. Leger's Day" is a reference to a September horse race in England.
That's the entire intellectual foundation. 18th century lords on holiday. The fact that it's still quoted in 2026 says more about how much traders love a catchy rule than it does about market reality.
That said. there is some data behind it. Let's look at what it actually says.
What the Historical Data Shows
The numbers are real, just not quite as dramatic as the saying implies.
Since 1945 through April 2026, the S&P 500 has gained an average of about 2% from May through October, compared with a roughly 7% average gain from November through April. That gap is meaningful. November through April is historically the stronger six months - your Week 2 seasonality article explained exactly why April tends to be strong, and this is the other side of that coin. But here's where beginners get misled. May through October is the weakest stretch on the calendar: 66% of the time with a 2.47% average return. November through April is the strongest, up 70% of the time with a 5.20% average. Notice those numbers. The summer period is still positive 66% of the time. That's not a reason to sell everything; it's a reason to be a little more cautious.
The picture gets even more nuanced when you break it down further. When Bank of America broke the May-October period into three-month windows, the picture flipped. June through August is actually the second-strongest three-month stretch of the year, returning 3.30% on average. The real pain is back-loaded into August through October, the only three-month period since 1928 with a negative average return. In other words: the saying should probably be "sell in August and go away." It just doesn't have the same ring to it.
What 2026 Specifically Looks Like
This year adds another layer of complexity — and this is where critical thinking matters more than blindly following a Wall Street rhyme.
The "Sell in May" theory is even weaker in 2026 because it's the second year of President Donald Trump's term. Looking at prior presidential cycles, Bank of America found that the S&P 500 has a strong bullish bias during this period. At the same time, looming over the outlook is the unresolved U.S.-Iran conflict and its potential drag on global growth. Investors also have to contend with a new Federal Reserve chair, as Kevin Warsh is expected to replace Jerome Powell at a time when analysts expect a bumpier rates path ahead. Strong presidential cycle tailwind on one side. Geopolitical risk and Fed uncertainty on the other. At best in 2026, "sell in May" is a 50-50 bet with asymmetric downside. That's not a trading signal — that's a coin flip dressed up in historical clothing.
The Real Lesson: Rules vs. Thinking
Here's the critical thinking moment this article is really about.
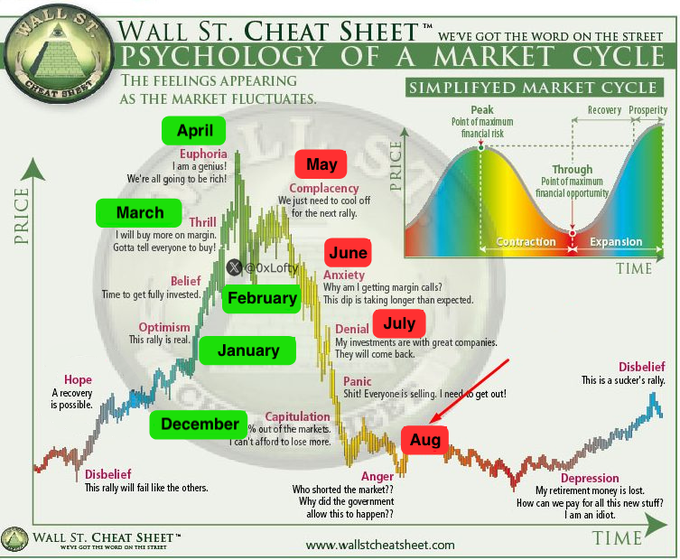
The traders who follow "sell in May" blindly are making the same mistake as the traders who chase every FOMO trade, revenge trade after a loss, or move their stop-loss further away because they can't accept being wrong. They're letting a feeling, in this case, the comfort of a simple rule, replace actual thinking.
The three years where "sell in May" actually worked, 2011, 2015, and 2022, each shared one characteristic: a specific, identifiable macro catalyst driving the selloff. A debt ceiling standoff. China slowdown fears. The fastest Federal Reserve rate-hiking cycle in 40 years. The saying didn't predict those years. The macro conditions did. Your job as a developing trader is to learn to read those conditions, not memorize rhymes.
Rather than exit the market, you could consider sector rotation if you are making tactical trades with some percentage of your portfolio and calendar trends are a component of your strategy. That's a far more sophisticated response to seasonality than "sell everything in May."
What You Should Actually Do
You're running a simulator this month at $1000. Here's how to apply this article practically:
- Watch, don't react. Pay attention to how the market behaves through May and June. Does it hold up? Does it drift? Does it drop sharply in August the way the data suggests it might? You're gathering real-time evidence against the historical record.
- Check your positions against the checklist. Your Week 3 pre-trade checklist doesn't change because of a seasonal saying. Position size, stop-loss, risk-to-reward — those rules apply in May exactly as they did in March.
- Notice sector rotation. Even if the broad market holds up, some sectors tend to underperform in summer while others hold up better. Healthcare and consumer staples have historically been more resilient in the May-October window. Technology tends to be more volatile. That's worth watching in your simulator.
Most importantly, don't sell your simulator positions based on a Wall Street rhyme. Use this month to build your own evidence. By the time July arrives and real money is on the line, you'll have watched a full seasonal transition with your own eyes.
That's worth more than any saying born on a 19th century horse racing calendar.
Join the simulator: Password Qritical70
References


Responses