
If you're new to trading, you've probably heard traders mention "support" and "resistance" in almost every market discussion. There's a good reason for that, these horizontal price levels form the foundation where traders identify high-probability entry scenarios with favorable risk-reward ratios. Think of them as invisible barriers on your charts that help predict where prices might pause, reverse, or break through to new territory.
What Are Support and Resistance?
In simple terms, support is where an asset's price tends to stop falling, while resistance is where it tends to stop rising. These aren't arbitrary lines, they represent real psychological battlegrounds where buyers and sellers clash. Support levels form when buying interest is strong enough to overcome selling pressure, causing prices to bounce upward. Resistance forms when selling pressure exceeds buying interest, pushing prices back down. When price action reverses direction, it leaves behind peaks and troughs that create these important swing points.
Why Do These Levels Matter?
These levels work effectively across all markets and timeframes because they reflect collective market behavior. When thousands of traders are watching the same price levels, their combined actions often create self-fulfilling prophecies. Previous turning points become areas where traders place orders, creating clusters of buying or selling activity.
How to Identify Support and Resistance
For beginners, start with these practical methods:
-
Look for swing highs and lows: Mark recent peaks (potential resistance) and valleys (potential support) on your charts.
-
Connect multiple touches: A level confirmed by multiple price reactions is more reliable than a single touch.
-
Focus on higher timeframes first: Daily and weekly charts typically show more significant levels with longer-lasting impact than shorter timeframes.
-
Watch for round numbers: Psychological levels like $50, $100, or $150 (or maybe $5, $10, or $15) often act as natural barriers.
Three Beginner-Friendly Trading Strategies
Once you can identify these levels, here are three straightforward approaches to trade them:
1. Range Trading: In sideways markets, identify a defined range with at least three touches on both boundaries, then buy near support and sell near resistance. Wait for confirmation through rejection candles (those with long wicks showing price was pushed back), and place your stop-loss just outside the zone.
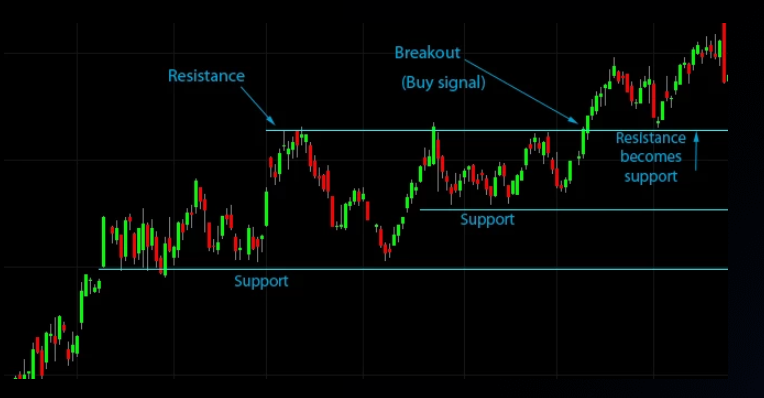
2. Breakout Trading: Trade breakouts when price closes beyond a strong resistance or below support, confirmed with a volume spike. The key word here is "confirmed"—many breakouts fail, so look for increased trading volume and consider entering on the retest for better risk-reward.
3. Role Reversal (Polarity Principle): After a resistance level is broken decisively, it often becomes new support, and vice versa. This creates excellent entry opportunities when price returns to test the broken level from the other side.
Common Mistakes to Avoid
Don't try to draw every possible level on your charts, you will end up with a cluttered mess. Focus on the key daily chart levels as these are the most important ones. Also remember that these lines won't always touch the exact highs or lows, sometimes it's acceptable if the line connects bars slightly above or below. Never trade blindly at these levels; quality matters more than quantity; strong reactions at support or resistance are more significant than multiple weak touches.
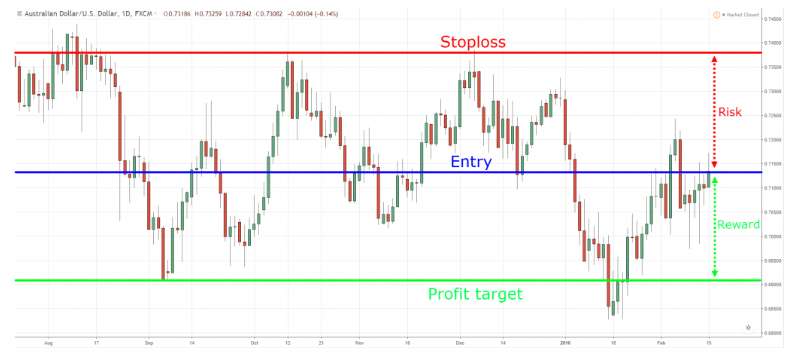
Risk Management Is Essential
Because price movement around support and resistance is never guaranteed, proper risk management is essential. Always use stop-loss orders, and consider confirming your trades with additional indicators like RSI or volume analysis before entering positions.
Support and resistance analysis isn't about predicting the future with certainty, it's about identifying high-probability zones where the odds favor your trades. These levels work on all timeframes, but starting your analysis on higher timeframes to identify major levels, then moving to lower timeframes for execution, typically yields the best results.
As you gain experience, you'll develop an eye for spotting these levels quickly and understanding the market psychology behind them. Start practicing on a demo account, mark levels consistently, and keep a trading journal to track which setups work best for your style. You can also join our trading challenge to practice these skills over the coming months.
References:
-
Mind Math Money. "Master Support and Resistance Trading: The Ultimate Guide for All Markets (2025)"
-
Price Action. "Support and Resistance Levels Trading Strategy"
-
NAGA. "How To Trade Based on Support and Resistance Levels" (December 2025)
-
Optimusfutures. "Support and Resistance Trading: Complete Guide for Futures (2025)"
-
Equiti. "Explained: the role of support and resistance in technical trading" (November 2025)
- Trading Shastra. "Support & Resistance Guide – Proven Trading Strategy 2025"


Responses