
As we embark on February 2026, the market dynamics are shifting, particularly with the sector rotation that began in December 2025. Moving averages (MAs) remain essential tools for traders, helping to identify trends and make informed decisions. This article will discuss the application of both simple moving averages (SMA) and exponential moving averages (EMA) in recognizing market trends and how to utilize these indicators in conjunction with sector rotation analysis.
Understanding Moving Averages
1. Simple Moving Average (SMA)
- Definition: The SMA calculates the average of closing prices over a specified period, providing a smooth representation of price trends. It is particularly useful for identifying support and resistance levels.
- Application: Common periods include the 50-day and 200-day SMAs. Traders often look for crossovers to signal potential trend changes. For instance, when the 50-day SMA crosses above the 200-day SMA, it may indicate a bullish trend.
2. Exponential Moving Average (EMA)
- Definition: The EMA gives more weight to recent prices, making it more responsive to new information. This makes it beneficial for identifying short-term trends.
- Application: Traders often use the 12-day and 26-day EMAs to capture quick price movements. A bullish crossover occurs when the short-term EMA crosses above the long-term EMA, signaling a buying opportunity.
Setting Up Trades Using Moving Averages
Short-Term vs. Long-Term Trading
- Short-Term Trading: Use shorter EMAs (like the 10-day) to identify quick price changes. A crossover above a longer SMA can signal a buying opportunity.
- Long-Term Trading: Longer SMAs (like the 200-day) help establish the overall trend. Prices consistently above this moving average indicate bullish conditions.
Strategies for February
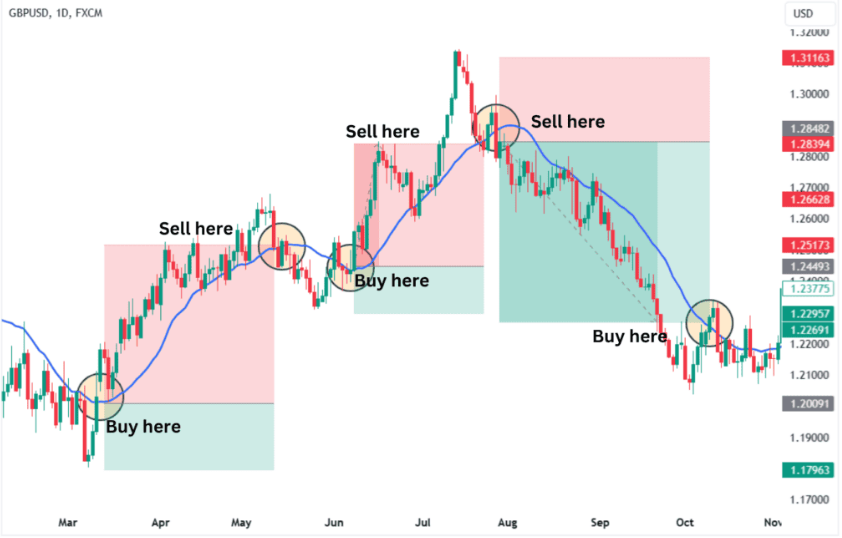
- Identify Key Levels: Moving averages can act as support or resistance levels. Pay attention to how prices interact with these averages, especially in volatile markets.
- Crossover Signals: Look for crossover signals as potential entry or exit points. For example, a bullish crossover between the 10-day EMA and the 50-day SMA can be a strong buy signal.
Sector Rotation and Current Opportunities
As we begin 2026, many investors are rotating out of the overvalued tech sector, particularly AI stocks, which experienced strong performance in 2025. The belief that these stocks are overvalued opens the door to opportunities in sectors that may be trading below fair value.
1. Key Sectors to Watch:
- Financials: With expectations of lower interest rates, the financial sector could see a revival. Stocks like Bank of America and Capital One, trading at attractive valuations, present potential buying opportunities.
- Industrials: Expected infrastructure demand and capital expenditures could boost this sector, making companies like Boeing and Honeywell attractive investments.
- Utilities: The utilities sector is poised to benefit from increased energy demands, particularly from data centers. Stocks like Exelon and Pacific Gas & Electric are trading at appealing valuations relative to sector averages.
2. Using Technical Indicators for Sector Analysis
- Combine moving averages with other indicators like RSI or MACD to gauge momentum in these sectors. For instance, sectors demonstrating rising EMAs alongside a strong RSI may indicate strong bullish trends.
Current Market Conditions and Seasonality
February historically presents unique challenges and opportunities for traders. Here are some key insights:
- Market Sentiment: Historically, February has been a mediocre month for U.S. stocks, with the S&P 500 averaging a return of +0.1% over the last 35 years. However, the start of 2026 has seen a positive tone, with a 1.3% rise in the S&P 500.
- Volatility: February often sees increased volatility, with the VIX rising by an average of 5.5% since 1990. Traders should be prepared for potential price swings, particularly influenced by geopolitical events and economic data.
- Sector Performance: The “Magnificent 7” AI stocks have seen waning momentum, suggesting a shift back to more traditional sectors. Monitoring this rotation can provide traders with valuable insights into emerging opportunities.
Moving averages are a powerful tool for identifying trends and making informed trading decisions. By understanding the differences between SMAs and EMAs, traders can tailor their strategies to their trading style and timeframe. As we navigate February 2026, focusing on sector rotation and utilizing moving averages can help identify promising investment opportunities in financials, industrials, and utilities. By combining these techniques with a keen awareness of market sentiment, traders can enhance their strategies and improve their chances of success.
Do you see yourself looking more at financials, industrials, or utilities this month?
Sources:


Responses